Best States for Pharmacy Technicians: Pay After Cost of Living
Updated · Data: BLS May 2025 OEWS (released May 2026), BEA price parities 2024
A higher salary is not always more money. This page ranks all 50 states and DC by what a pharmacy technician's median pay is worth after local prices, using federal wage and price data, and shows each state's certification rule and application fee beside it.
Quick answer
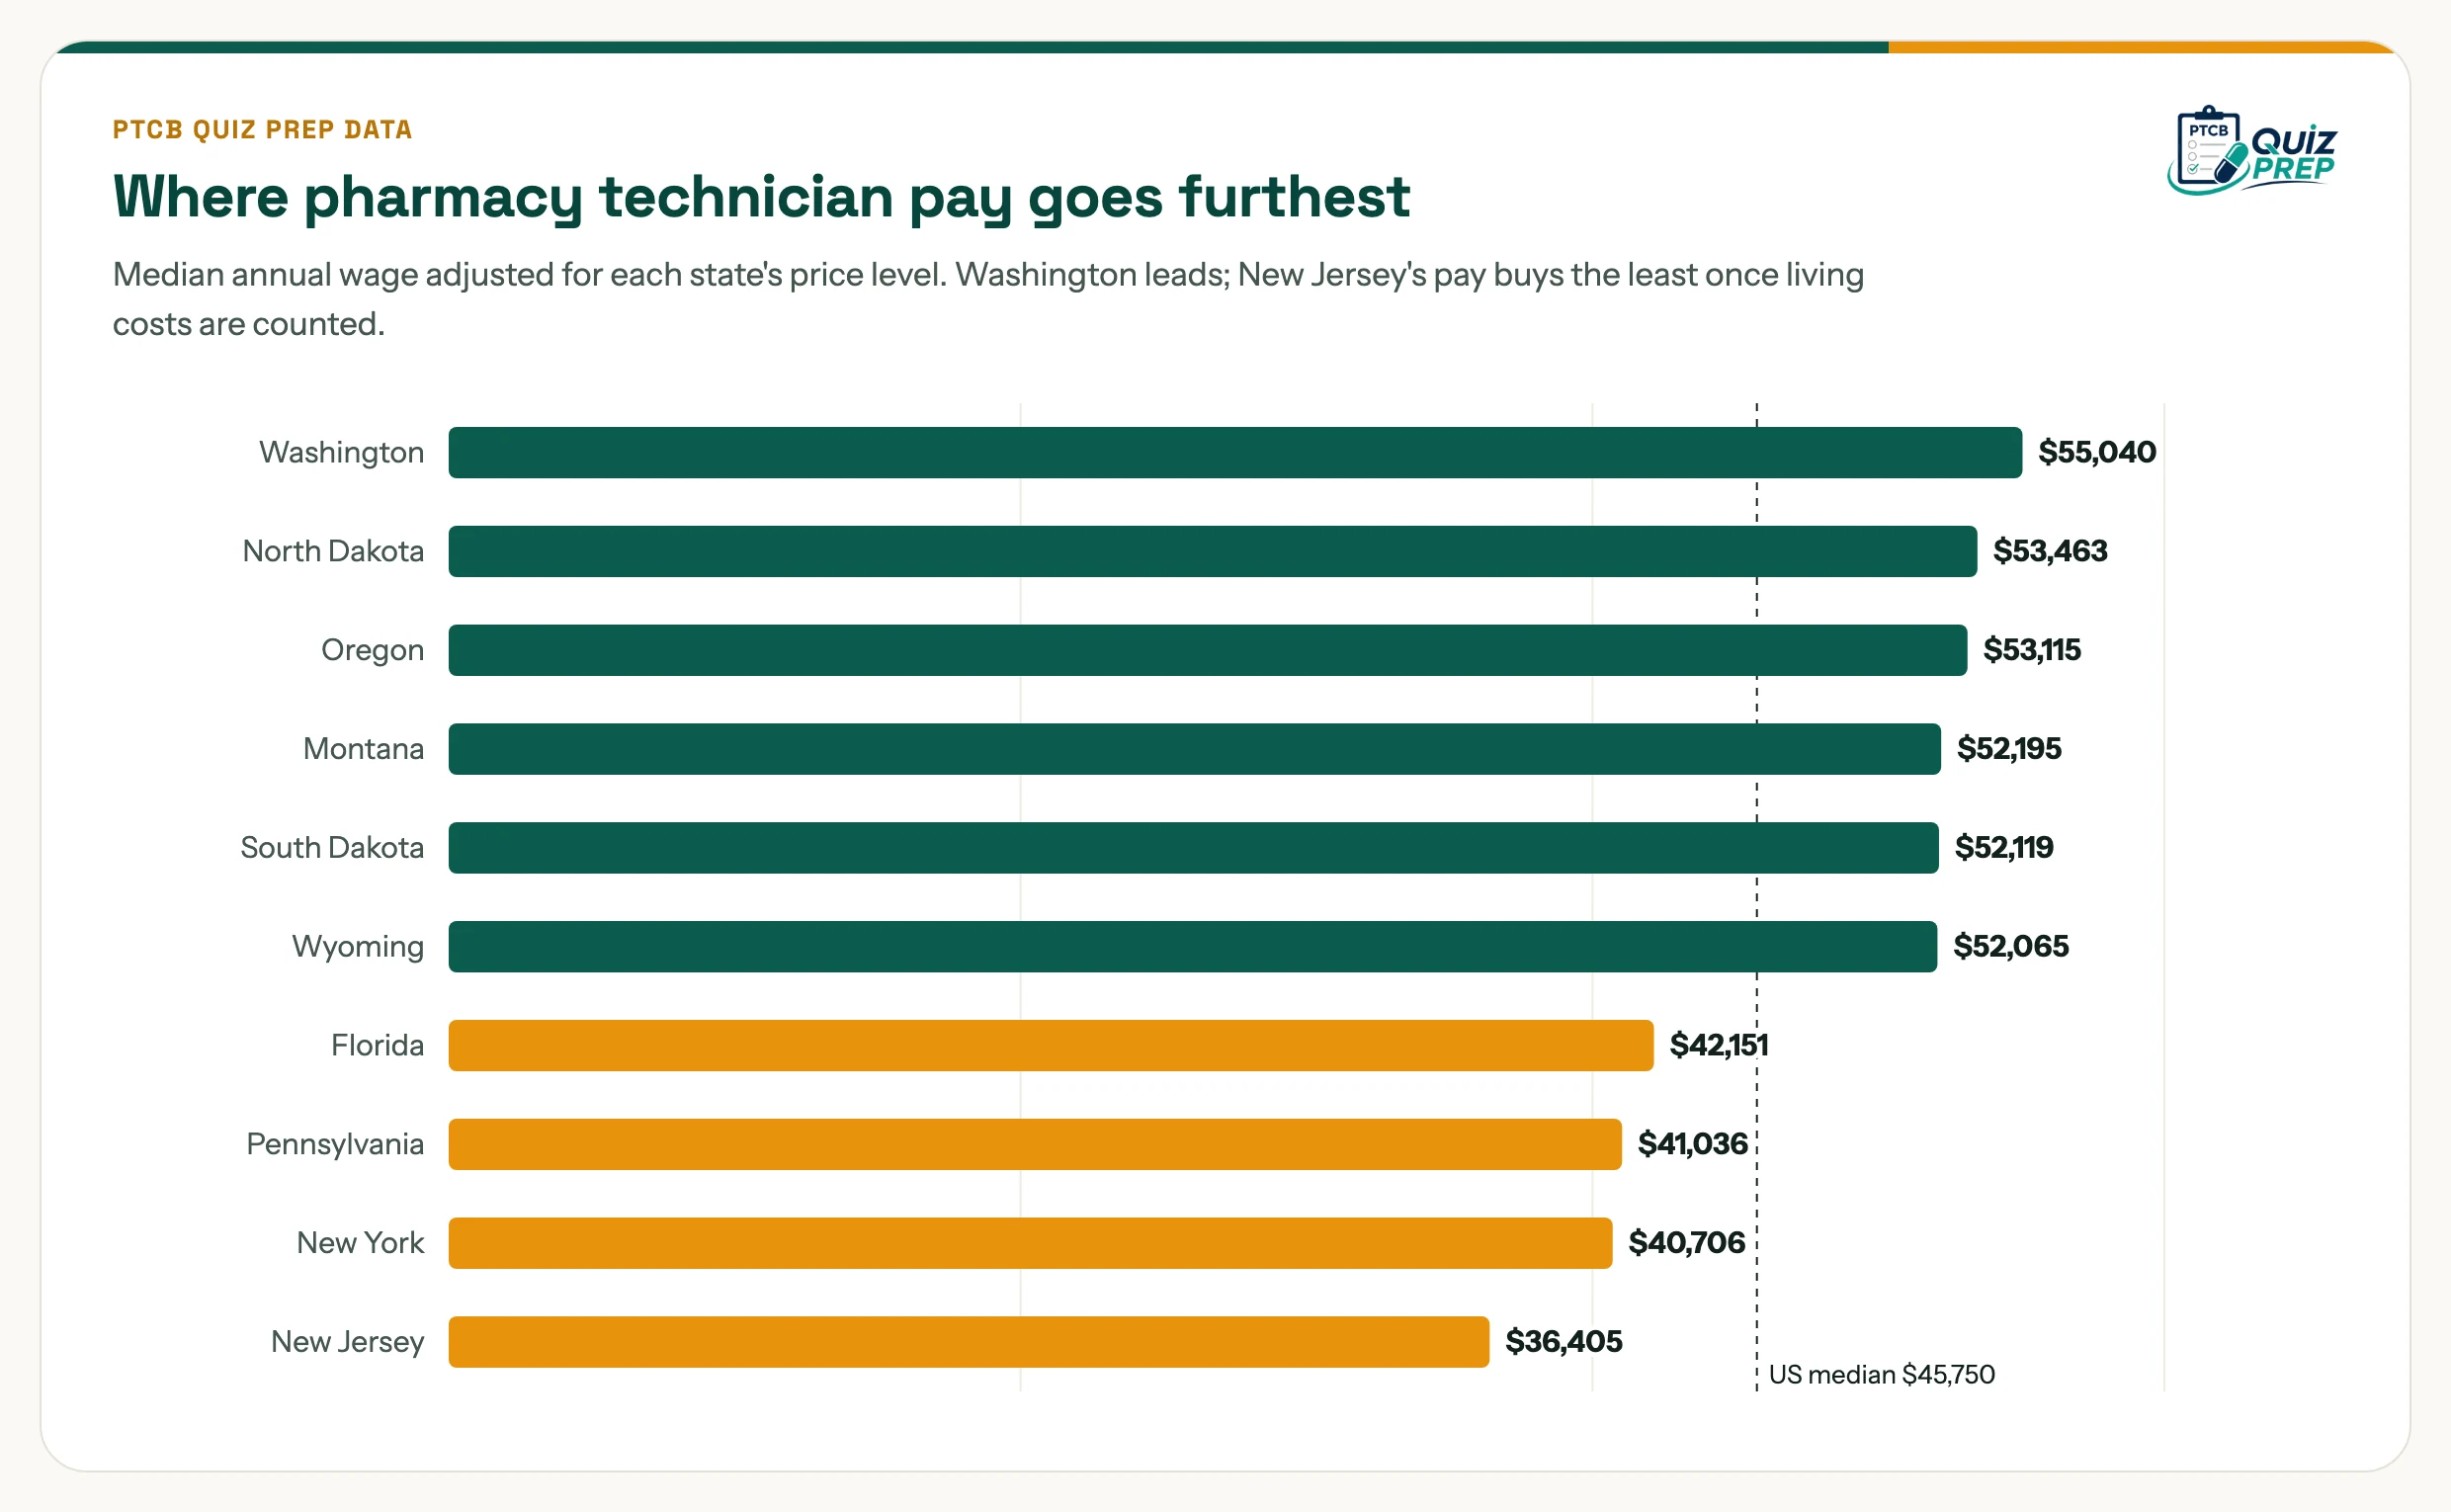
Washington is the best state for pharmacy technician pay: a $58,900 median, worth $55,040 at national prices. North Dakota, Oregon, Montana and South Dakota follow. New Jersey ranks last at $36,405. The US median is $45,750.
What changes when you count living costs
- California drops. It has the 2nd highest median ($55,110) but falls to 12th after prices.
- Hawaii and DC fall furthest. Hawaii goes from 17th to 47th and DC from 14th to 44th.
- Lower-cost states climb. Louisiana rises from 33rd to 11th, and North Dakota, South Dakota, Iowa and Nebraska all move into the top 10.
- 29 of 51 beat the $45,750 US median once prices are counted.
All 50 states and DC, ranked
Click a state for its registration, certification and renewal rules.
| Rank | State | Median pay | Price parity | Adjusted pay | Certification | Application fee |
|---|---|---|---|---|---|---|
| 1 | Washington | $58,900 | 107.0 | $55,040 | Required | $140 |
| 2 | North Dakota | $47,560 | 89.0 | $53,463 | Required | $35 |
| 3 | Oregon | $54,900 | 103.4 | $53,115 | Only for a higher tier | $140 |
| 4 | Montana | $49,400 | 94.6 | $52,195 | Required | $35 |
| 5 | South Dakota | $46,170 | 88.6 | $52,119 | Not required | $25 |
| 6 | Wyoming | $48,260 | 92.7 | $52,065 | Required | $50 |
| 7 | Nebraska | $46,610 | 90.1 | $51,730 | Required | $25 |
| 8 | Alaska | $52,640 | 102.4 | $51,427 | Not required | $25 |
| 9 | Iowa | $44,860 | 87.8 | $51,116 | Required | $20 |
| 10 | New Mexico | $46,630 | 92.2 | $50,568 | Required | $25 |
| 11 | Louisiana | $44,410 | 88.2 | $50,347 | Required | $100 |
| 12 | California | $55,110 | 110.7 | $49,774 | Optional qualifying pathway | $120 |
| 13 | Minnesota | $48,300 | 98.6 | $48,975 | Optional qualifying pathway | $60 |
| 14 | Vermont | $47,940 | 98.0 | $48,939 | Optional qualifying pathway | $70 |
| 15 | Wisconsin | $45,970 | 94.1 | $48,855 | Not required | $30 |
| 16 | Utah | $48,140 | 98.9 | $48,693 | Required | $60 |
| 17 | Idaho | $46,420 | 95.5 | $48,610 | Not required | $70 |
| 18 | Colorado | $49,970 | 103.1 | $48,490 | Required | See board |
| 19 | Kansas | $43,310 | 90.1 | $48,086 | Required | $77 |
| 20 | Nevada | $47,980 | 100.0 | $47,990 | Not required | $50 |
| 21 | Indiana | $44,560 | 93.3 | $47,745 | Optional qualifying pathway | $25 |
| 22 | Arizona | $47,640 | 100.7 | $47,320 | Required | $82 |
| 23 | Texas | $45,900 | 97.1 | $47,292 | Required | $88 |
| 24 | North Carolina | $44,530 | 94.3 | $47,209 | Optional qualifying pathway | $30 |
| 25 | Maine | $45,400 | 97.0 | $46,780 | Not required | $20 |
| 26 | Illinois | $46,650 | 100.0 | $46,670 | Required | $50 |
| 27 | Delaware | $46,430 | 99.8 | $46,519 | Not required | See board |
| 28 | Oklahoma | $40,500 | 87.8 | $46,105 | Not required | $40 |
| 29 | Michigan | $44,340 | 96.2 | $46,083 | Optional qualifying pathway | $137.7 |
| 30 | Tennessee | $41,920 | 91.9 | $45,630 | Not required | $55 |
| 31 | New Hampshire | $47,360 | 104.2 | $45,466 | Only for a higher tier | $138 |
| 32 | Connecticut | $47,050 | 103.6 | $45,411 | Only for a higher tier | $100 |
| 33 | South Carolina | $42,120 | 93.7 | $44,928 | Only for a higher tier | $56 |
| 34 | Mississippi | $39,040 | 87.0 | $44,898 | Not required | $50 |
| 35 | Arkansas | $38,680 | 86.9 | $44,492 | Not required | See board |
| 36 | Missouri | $40,100 | 90.8 | $44,155 | Only for a higher tier | $40 |
| 37 | Virginia | $44,610 | 101.1 | $44,123 | Required | $40 |
| 38 | Alabama | $39,030 | 88.8 | $43,941 | Not required | $60 |
| 39 | Massachusetts | $46,470 | 105.8 | $43,940 | Optional qualifying pathway | $150 |
| 40 | Ohio | $40,650 | 92.8 | $43,816 | Only for a higher tier | $65 |
| 41 | Georgia | $41,910 | 96.3 | $43,523 | Not required | $100 |
| 42 | Kentucky | $39,200 | 90.2 | $43,479 | Only for a higher tier | $25 |
| 43 | Rhode Island | $44,380 | 102.3 | $43,391 | Only for a higher tier | $25 |
| 44 | District of Columbia | $47,410 | 109.9 | $43,139 | Optional qualifying pathway | $50 |
| 45 | Maryland | $45,120 | 105.0 | $42,988 | Optional qualifying pathway | $45 |
| 46 | West Virginia | $38,210 | 89.5 | $42,694 | Required | $25 |
| 47 | Hawaii | $46,760 | 110.0 | $42,528 | Not required | $130 |
| 48 | Florida | $43,590 | 103.4 | $42,151 | Not required | $105 |
| 49 | Pennsylvania | $40,040 | 97.6 | $41,036 | Not required | $30 |
| 50 | New York | $43,930 | 107.9 | $40,706 | Required | $175 |
| 51 | New Jersey | $39,610 | 108.8 | $36,405 | Not required | $50 |
How we ranked the states
- Pay is the BLS median annual wage for pharmacy technicians (SOC 29-2052) in each state, May 2025 OEWS (released May 2026).
- Price parity is BEA's all-items regional price parity for 2024, where the US average is 100.
- Adjusted pay = median pay ÷ (price parity ÷ 100). The US median is not changed by the adjustment.
- Certification and application fee come from each state board, as listed on our state requirement pages. They are shown for comparison and do not affect the rank.
Limits: price parities are state averages, so a city like Seattle or Philadelphia can cost much more than its state figure. The wage and price data cover different years (2025 and 2024). Guam, Puerto Rico and the US Virgin Islands are left out because BEA publishes no price parity for them.
For pay by industry and setting, see the full pharmacy technician salary guide. To compare rules state by state, see pharmacy technician requirements by state.
Frequently asked questions
What is the best state to be a pharmacy technician?
Washington, on pay. It has the highest median pharmacy technician wage ($58,900) and still leads after adjusting for prices ($55,040). North Dakota, Oregon, Montana and South Dakota follow.
Where does pharmacy technician pay go the least far?
New Jersey. Its median wage of $39,610 is worth $36,405 at national prices, the lowest of any state. New York and Pennsylvania are next.
Does California pay pharmacy technicians the most?
California has the 2nd highest median ($55,110), but prices there are 10.7% above the US average, so it falls to 12th once living costs are counted.
How is adjusted pay calculated?
Adjusted pay is the state median annual wage divided by the state's price parity over 100. A price parity of 110 means prices are 10% above the US average, so $55,000 there buys about what $50,000 buys at average prices.
Do states that require certification pay more?
Not in a simple way. The table lists each state's certification rule beside its pay so you can compare, but pay also depends on the mix of hospital and retail jobs, local demand and housing costs.
More pharmacy technician data
- PTCB pass rate: PTCE vs ExCPT by year
- Pharmacy technician rule changes in 2025 and 2026
- How much it costs to become a pharmacy technician
Use this data
You are welcome to use these figures and charts with a link back to this page: PTCB Quiz Prep, "Best States for Pharmacy Technicians: Pay After Cost of Living", https://ptcbquizprep.com/best-states-for-pharmacy-technicians
Sources
Every figure on this page was checked against these sources on November 11, 2026.
- U.S. Bureau of Labor Statistics, OEWS May 2025 OEWS (released May 2026), state data, SOC 29-2052 Pharmacy Technicians. Median annual wage by state
- U.S. Bureau of Labor Statistics, Occupational Outlook Handbook: Pharmacy Technicians
- U.S. Bureau of Economic Analysis, Regional Price Parities by state, BEA Regional Price Parities 2024, released 2026-02-19. All-items price parity, US = 100
- PTCB Quiz Prep, pharmacy technician requirements by state (each board linked). Certification rule and application fee
PTCB Quiz Prep is an independent study resource, not affiliated with PTCB or NHA.